
Dashboard
Graph View
Visualize task dependencies and project structure as an interactive graph.
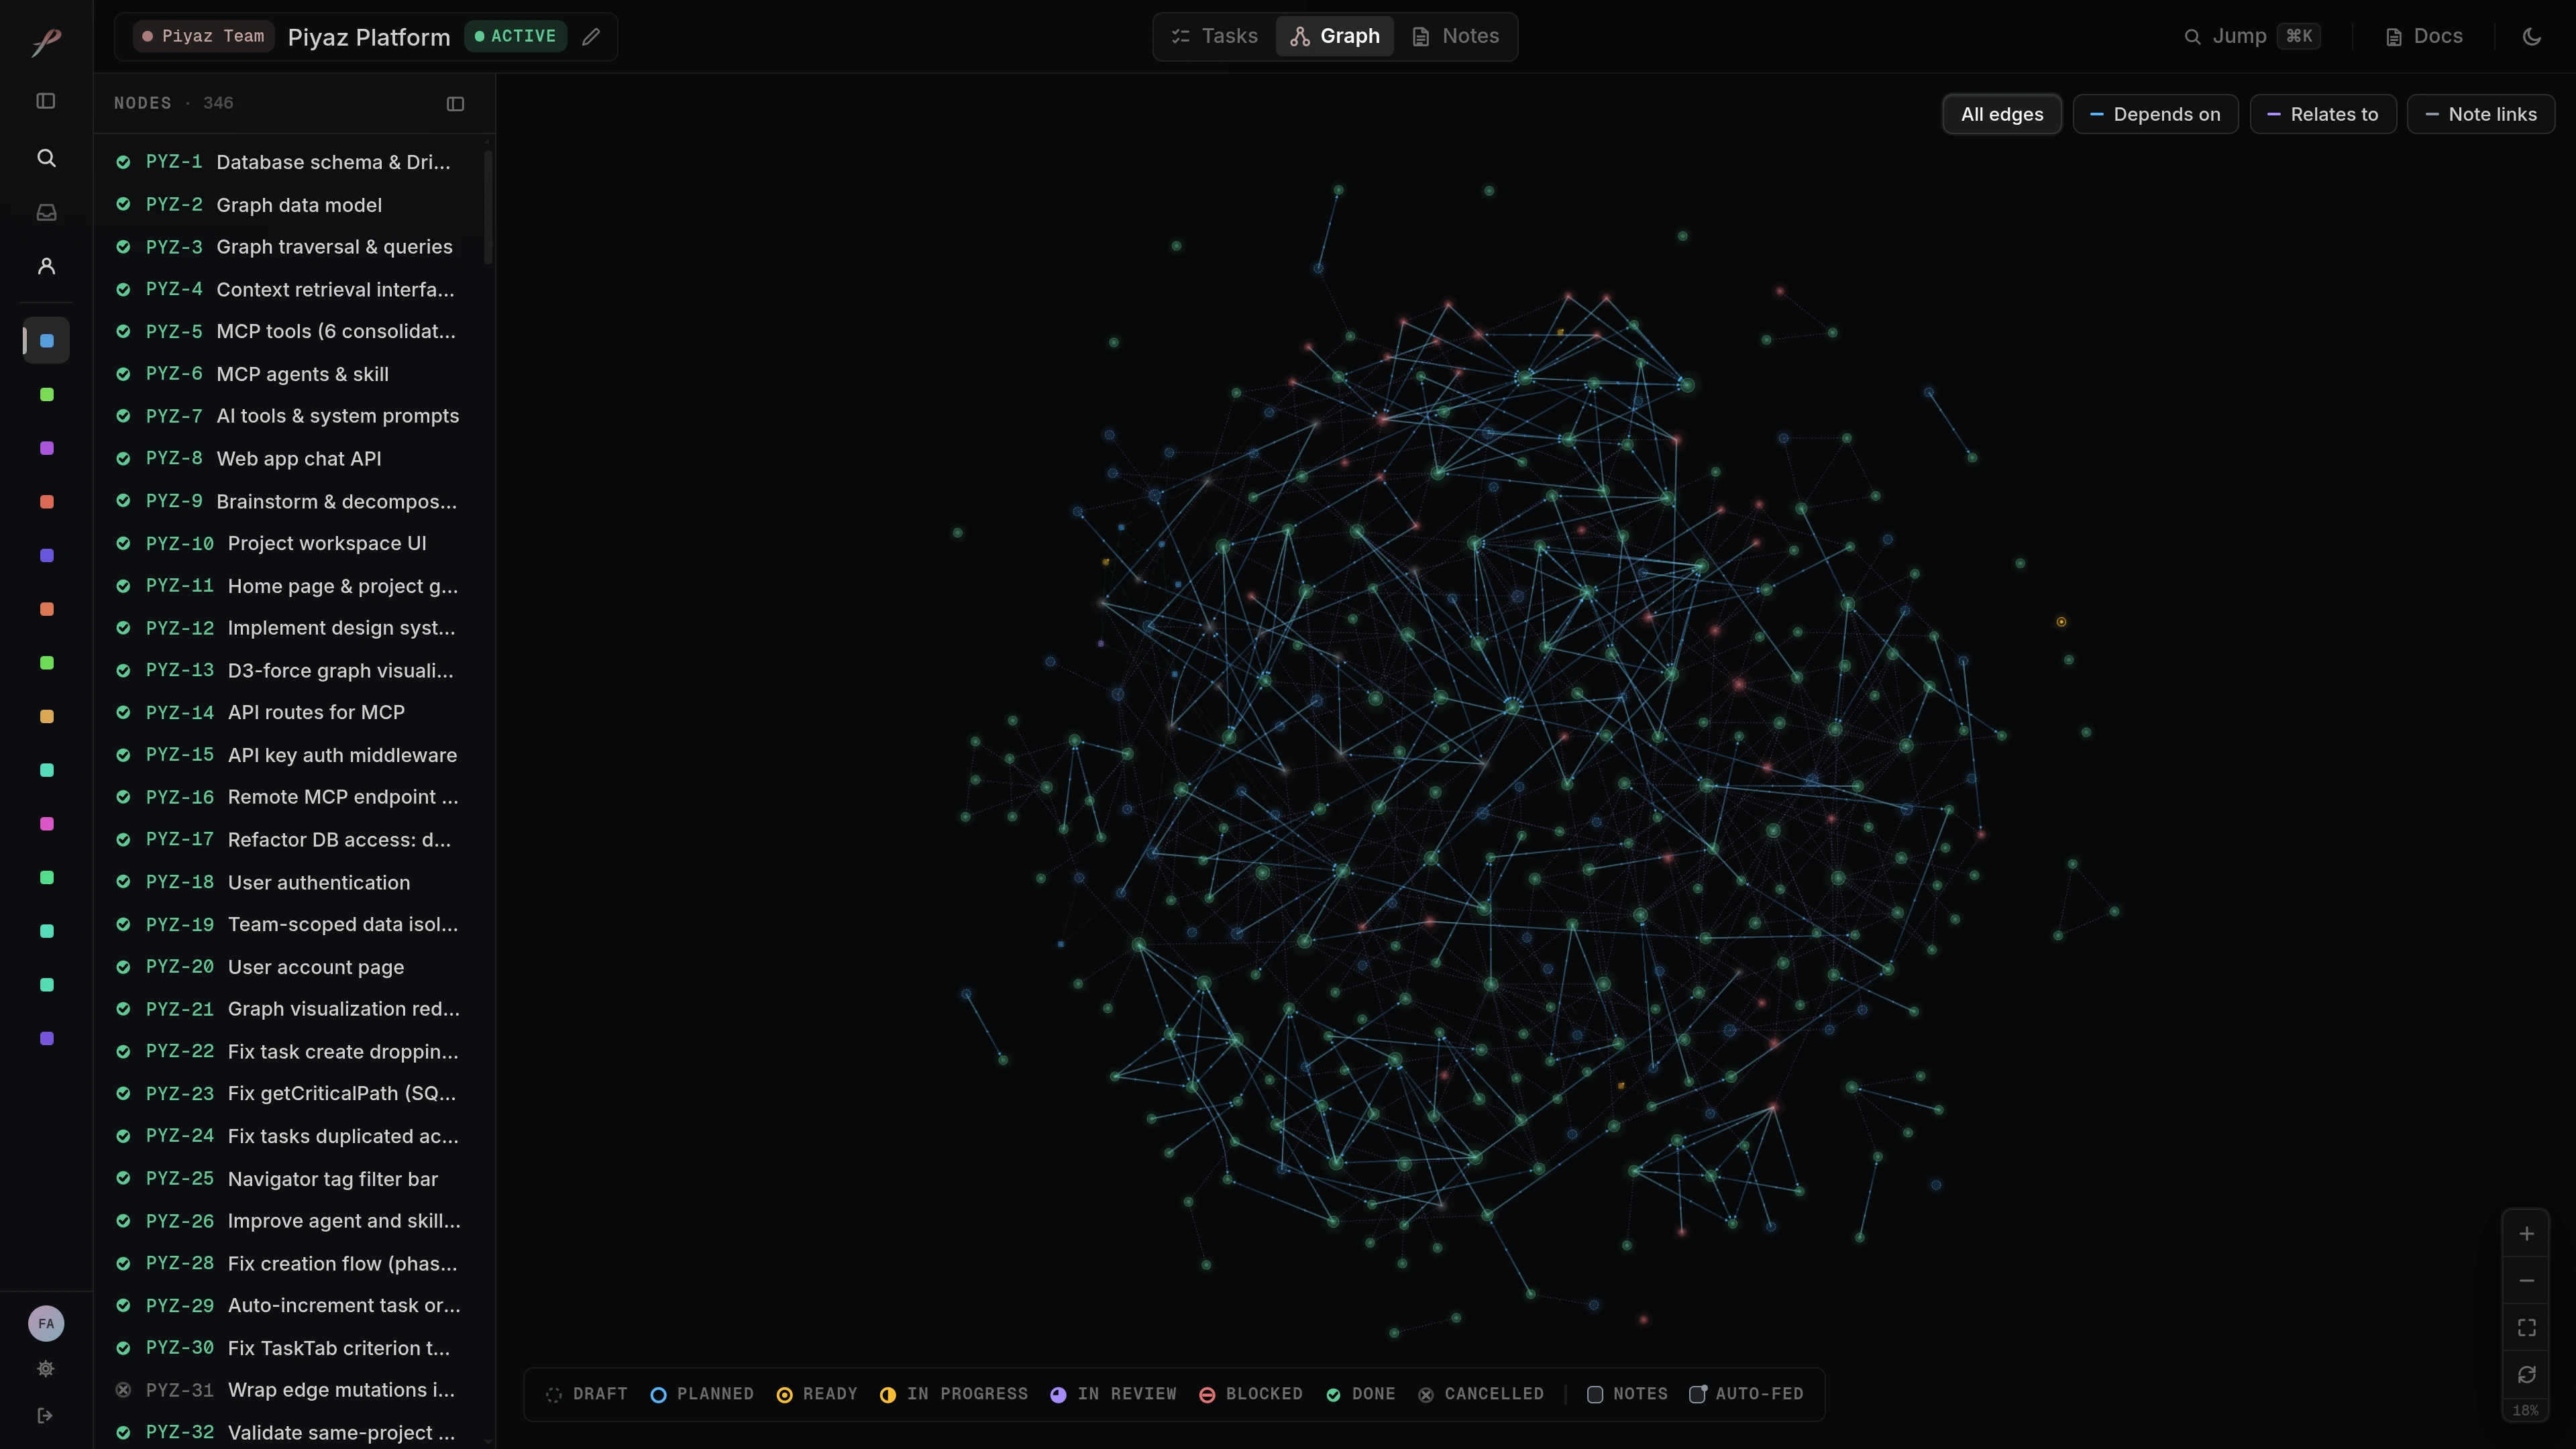
The graph view renders your project's task graph as an interactive force-directed visualization. Tasks are nodes, edges are links, and the layout reveals clusters, bottlenecks, and orphaned work at a glance.
Layout
The graph uses a D3 force simulation with:
- Center force pulling nodes toward the viewport center.
- Charge force pushing nodes apart to prevent overlap.
- Link force pulling connected nodes together.
The result is a self-organizing layout where tightly connected tasks cluster together and independent work drifts apart.
Interactions
- Click a task node to select it and open the detail panel; click a note node to preview it in place, with an Open in Notes handoff to the full editor.
- Drag nodes to reposition them. The simulation pauses while dragging and resumes on release.
- Zoom and pan with scroll and drag on the background.
Visual Encoding
- Node color reflects the task's state (draft, planned, ready, in progress, in review, blocked, done, cancelled), matching the legend beneath the canvas.
- Edge style distinguishes
depends_on(directional arrow) fromrelates_to(dashed line). - Note nodes render as rounded squares with a type-colored ring (reference, guidance, knowledge), and auto-fed notes carry a corner dot. Their edges to tasks show whether the note specifies, references, or mentions each task, and note-to-note links use their own style. See Notes.
- Selected node is highlighted with an accent ring.
When to Use Graph View
Graph view is most useful for:
- Seeing the big picture -- how tasks relate and where clusters form.
- Spotting bottlenecks -- nodes with many incoming edges are critical.
- Finding orphans -- disconnected nodes may be missing dependencies.
- Verifying decomposition -- after breaking a project into tasks, the graph shows whether the dependency structure makes sense.
For day-to-day task management, the Tasks (list) view in the navigator panel is typically faster. Switch to the graph view when you need spatial reasoning about the project's structure.
Last updated